Selection of Land Monitoring Method
- May 18, 2025
- 3 min read
As every spring, we conduct aerial imaging of our clients’ fields, particularly those affected by damage, using unmanned aerial vehicles.The goal is to assess the extent of the damage and to create prescription maps for skipping damaged areas during pesticide and liquid fertilizer application. Our daily capacity, including processing, can reach up to 1,000 hectares. For each field, we quantify the level of damage, deliver the source data, and prepare a prescription map in any desired format. If the customer uses our SAS Cropwise Operations platform, we upload all data directly into it. All this is done within 24 hours of imaging and, in the vast majority of cases, within 48 hours of the customer's request. Despite the efficiency of this approach, the economic return of such imaging is frequently debated.
Fig. 1. For imaging field damage, a UAV equipped with an RGB camera is fully sufficient

In addition to aerial imaging, we also offer our clients mediation services for the purchase of unmanned aerial vehicles, the necessary photogrammetric software, consulting, and training — including imaging and data processing. We recommend uploading all captured data to the SAS Cropwise Operations platform, where it is available to users at any time and without data volume limitations. The platform also offers access to Sentinel satellite images (10 x 10 m) and Planet Scope images (3 x 3 m) at very competitive prices.
Differences in result quality
Which data source is best for the customer in the case of major field damage? As part of our verification process, we created prescription maps for selective applications using satellite data from Sentinel, Planet Scope, and a UAV for several fields. It should be noted that these were relatively simple fields, where most of the damage was concentrated in just a few zones. In the case of damage caused by voles, the results would be drastically different.
Fig. 2 Prescription map based on Sentinel satellite data (10 x 10 m).

Fig. 3 Prescription map based on Planet Scope satellite data (3 x 3 m).
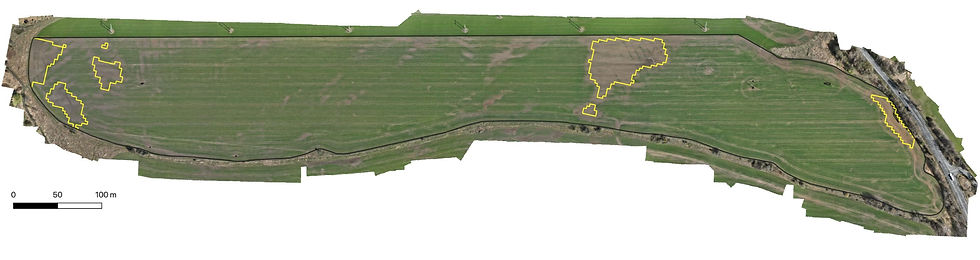
Fig. 4 Prescription map based on UAV data (5 x 5 cm).

Orthophotos in Figures 2, 3, and 4 were created using an unmanned aerial vehicle.
The key evaluation criterion for us is the economic benefit of the strategy. In this context, we set the treatment cost at 4,000 CZK/ha and 6,000 CZK/ha for a field with a total area of 32.48 hectares. The imaging and data processing from the UAV was priced at 150 CZK/ha. For satellite imagery, we based our calculations on our market prices for Sentinel and Planet Scope satellite data — these are prices for the complete solution, as satellite imagery alone cannot be offered without accompanying tools.
Despite the higher percentage of savings achieved using the UAV method (drone), the overall cost savings were not greater than those achieved with the lower-resolution Planet Scope satellite imagery in the lower-cost treatment scenario.
Tab. 1 Cost and benefit calculation of individual solutions (treatment cost 4,000 CZK/ha).
Metod | CZK/ha | CZK/field | Savings (ha) | Savings (%) | Savings CZK | Benefit CZK |
UAV | 150 | 4875,0 | 2,929 | 9,0126 | 11716,4 | 6841,4 |
PlanetScope | 55 | 1787,5 | 2,193 | 6,7495 | 8774,4 | 6986,9 |
Sentinel | 45 | 1462,5 | 2,081 | 6,4043 | 8325,6 | 6863,1 |
In contrast, at the higher cost scenario (6,000 CZK/ha), the benefit of using an unmanned aerial vehicle (drone) is greater. What does this imply? Determining a suitable monitoring strategy is not simple and requires a certain level of experience. Nevertheless, I believe we can help our clients choose the right strategy — even based on just a smartphone photo combined with satellite imagery.
Tab. 2 Cost and benefit calculation of individual solutions (treatment cost 6,000 CZK/ha).
Metod | CZK/ha | CZK/field | Savings (ha) | Savings (%) | Savings CZK | Benefit CZK |
UAV | 150 | 4875,0 | 2,929 | 9,0126 | 17574,6 | 12699,6 |
PlanetScope | 55 | 1787,5 | 2,193 | 6,7495 | 13161,6 | 11374,1 |
Sentinel | 45 | 1462,5 | 2,081 | 6,4043 | 12488,4 | 111035,9 |
Risks and Pitfalls
Does the use of satellite imagery seem simple and effective to you? To us, it partly does as well. Unfortunately, satellite images can have positional inaccuracies, and data interpolation may amplify the issue. That’s why we recommend physically verifying the section control switching when using satellite data.
From the perspective of an agricultural software provider, I see a challenge in recording field operations, as the software cannot identify the completion of a field with skipped (damaged) areas. This requires manual editing of the activity record. It’s not a critical error, but rather a point for consideration for the development team.
Fig. 5 Error in field records caused by skipping damaged areas.

What do you think about the results? Are our services and work of interest to you, or would you be interested in collaboration? Feel free to contact me.


